The 4-Star Rating Problem: 84% of the 30,470 rated listings we track are 4.0★ or better
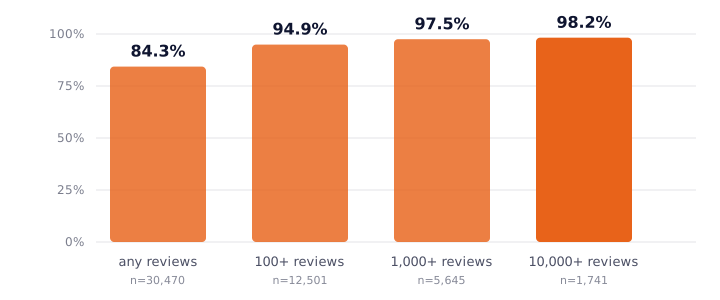
And the standard advice — only trust products with a lot of reviews — does not rescue it. Among the listings in our catalogue with more than 10,000 reviews, 98.2% are rated 4.0 or above. Deeper review counts go with less separation in the displayed rating, not more: the heavily-reviewed listings are the most tightly packed of all.
This is our own capture set, not a survey of Indian e-commerce. Our coverage is uneven — we have collected some parts of the market far more deeply than others — so we break every figure down by platform and by category, and say exactly what that does and does not license us to claim, in the body of this page rather than in a footnote.
Snapshot: 19 August 2026n = 30,470 rated listings
By the ChayanKart Editorial DeskPublished 19 Aug 2026Version 1.0 · snapshot 19 Aug 2026Cite & download
The finding, in one table
We hold 66,150 product listings captured across six Indian marketplaces — Amazon India, Flipkart, Nykaa, Nykaa Fashion, Croma and Reliance Digital. Of those, 30,470 display a star rating (46.1%). We sorted them by how many reviews stand behind the rating, then asked one question: does thicker evidence produce a wider spread of scores?
It does the opposite.
Share rated 4.0★ or above, by review depth
Review count
Listings
Rated 4.0+
Median rating
Any rating shown
30,470
84.3%
4.30
100 or more reviews
12,501
94.9%
4.30
1,000 or more reviews
5,645
97.5%
4.30
10,000 or more reviews
1,741
98.2%
4.30
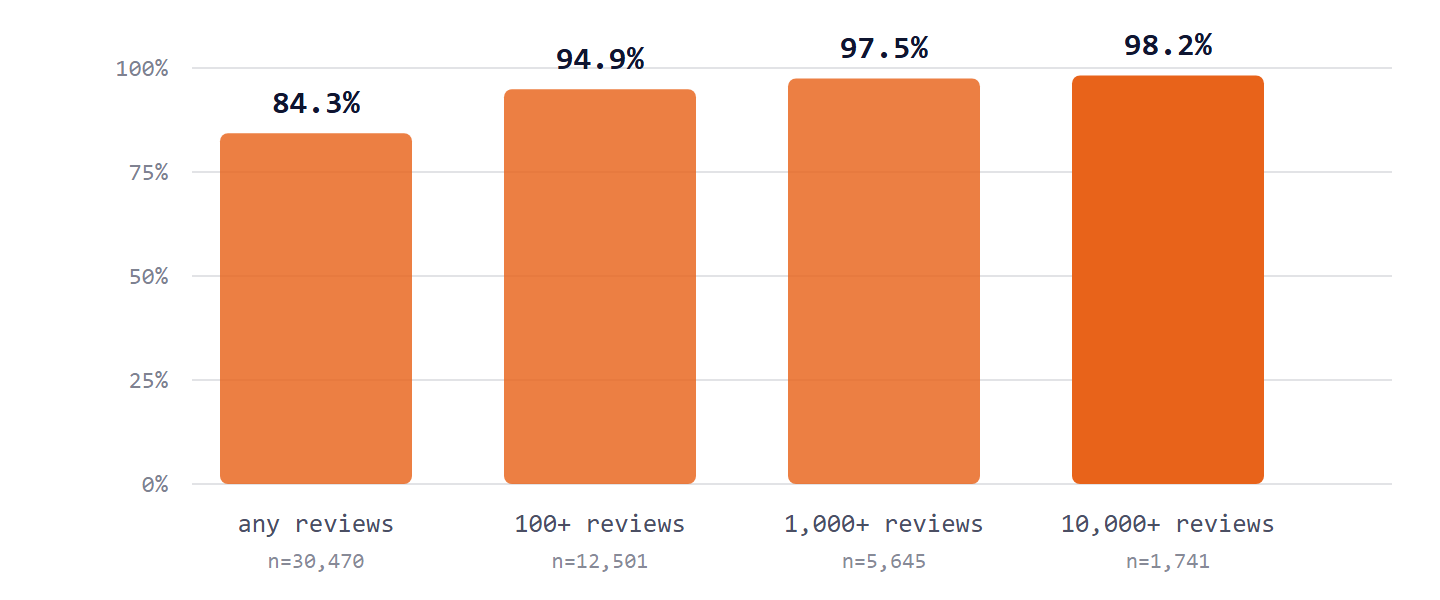
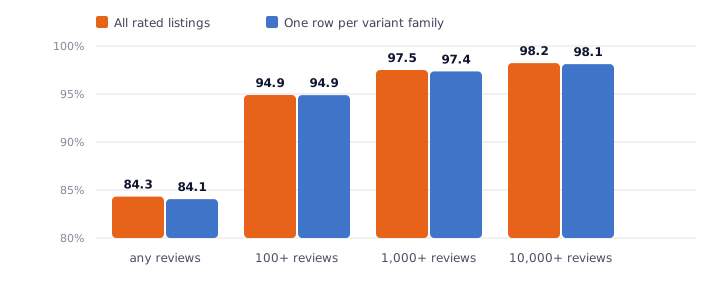
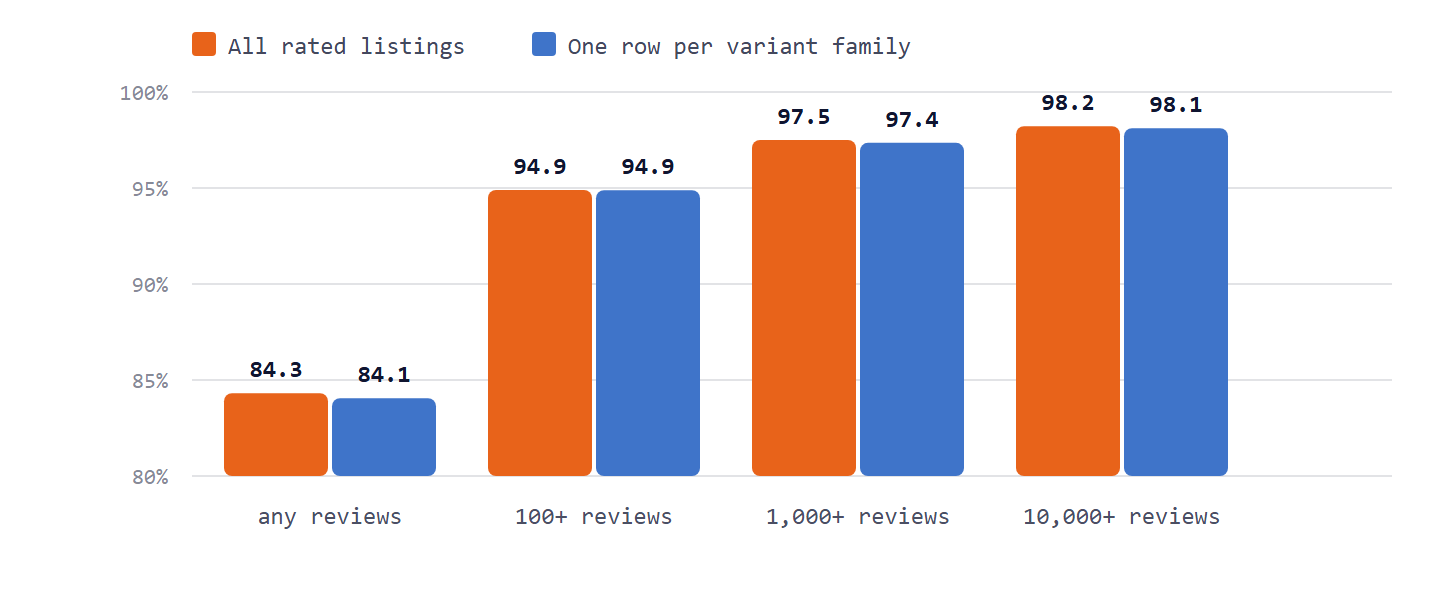
Every bar is the share of listings rated 4.0★ or above. More reviews does not mean more separation — it means less. The median rating is 4.30 at every one of these thresholds.
The median rating does not move at all — 4.30 at every level of evidence.
A shopper filtering for well-reviewed products is not narrowing the field in the way they expect. They are moving from a set where roughly one listing in six falls below 4.0 to a set where fewer than one in fifty does. Filtering for heavily reviewed listings leaves very little of the lower-rated tail in view.
The discrimination problem
66.1%
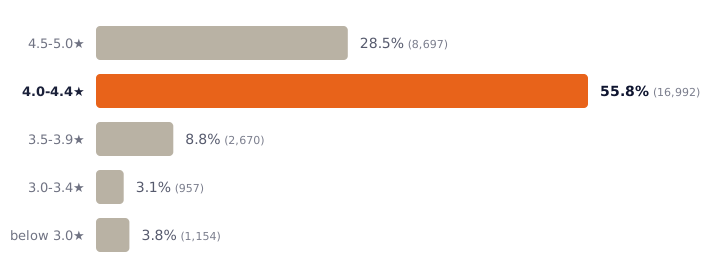
of the 25,689 listings rated 4.0 or above sit inside a single 0.4-star window, between 4.0 and 4.4. That is the formal finding: across two-thirds of the listings it covers, the star rating offers almost no discrimination. Read plainly — a number that cannot separate two-thirds of what it describes is not a measurement. It is a formality.
Where the ratings actually sit
Distribution of displayed ratings, n = 30,470
Rating band
Listings
Share
4.5 – 5.0
8,697
28.5%
4.0 – 4.4
16,992
55.8%
3.5 – 3.9
2,670
8.8%
3.0 – 3.4
957
3.1%
Below 3.0
1,154
3.8%
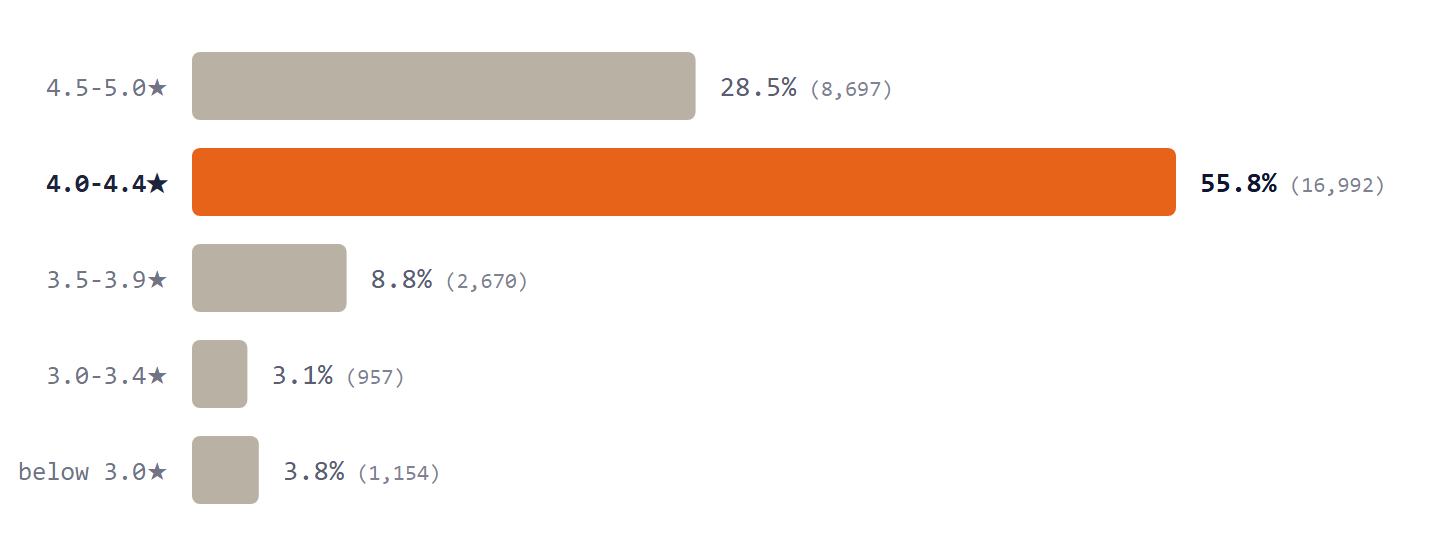
Two-thirds of everything rated 4.0★ or above sits inside the single highlighted band — a 66.1% crowd inside four-tenths of one star.
Only 3.8% of rated listings fall below 3.0 stars. On a five-point scale, four-fifths of the scale is doing almost no work. Also worth noting: 11,635 listings are rated 4.0 or above on fewer than 50 reviews — a strong-looking score on evidence too thin to support it.
It is not one marketplace
The pattern holds inside every platform where we have enough listings to say anything at all. That matters more than the combined figure, because the combined figure is shaped by which platforms we happen to have captured most heavily.
By marketplace
Marketplace
Rated listings
Rated 4.0+
Median
Big enough to quote?
Nykaa
18,666
85.2%
4.30
Yes
Flipkart
6,413
80.5%
4.20
Yes
Amazon India
4,947
88.2%
4.20
Yes
Croma
343
74.6%
4.50
No — do not quote
Reliance Digital
192
44.8%
3.75
No — do not quote
Nykaa Fashion
9
100.0%
5.00
No — do not quote
Read that last column. Croma, Reliance Digital and Nykaa Fashion are printed here for completeness and are not reportable. We set a floor of 1,000 rated listings before a platform figure means anything. Reliance Digital reads dramatically lower than everyone else — 44.8% — and we do not believe that number describes product quality. It almost certainly describes which of their pages display a review count at all. Quoting it as “Reliance sells worse products” would be a coverage artefact dressed up as a finding, and we would rather flag our own thin data than let someone repeat it.
By category (categories with 500+ rated listings)
Category
Rated listings
Rated 4.0+
Median
Beauty
15,350
86.2%
4.30
Fashion
4,281
79.6%
4.20
Electronics
3,628
76.5%
4.10
Home & Kitchen
1,352
84.5%
4.10
TV & Appliances
1,303
83.3%
4.20
Books & Media
1,217
95.6%
4.40
Health & Wellness
1,137
83.6%
4.30
Sports & Fitness
838
87.5%
4.20
Baby & Kids
624
86.1%
4.40
Electronics is the most discriminating category we measure, and even there 76.5% of listings clear 4.0. Books and media is effectively unusable as a signal at 95.6%. No category in our data uses more than about one star of the available range.
We tried to break our own finding
Three objections are obvious, and all three are fair. We ran them rather than waiting to be asked.
1. “Your catalogue lists the same product several times — you are counting duplicates.”
There is one mechanism by which this catalogue can count a product more than once, and it is worth naming precisely, because it is also the mechanism that could inflate the review counts this study leans on. Amazon publishes a single pooled review count across a parent listing’s variants — sizes, colours, capacities — while giving each variant its own product page. Capture those pages separately and one shoe in seven sizes becomes seven rows that all read “111,498 reviews”.
Those rows are identifiable: same platform, same title, identical review count. There are 642 such variant families, accounting for 1,237 excess rows — 4.1% of the rated set. The largest is a running shoe held eleven times. We collapsed every family to a single row and re-ran the study on the 29,207 that remain:
A repeated title alone is not a duplicate, and is not counted as one: 48 different GUESS watches are all listed as “GUESS Analog Watch — For Men”, priced ₹5,369 to ₹10,070, because the model number lives in the page rather than the title. They carry different review counts, they are 48 real products, and they stay in.
Headline figures with each variant family counted once
Review count
Listings
Rated 4.0+
As published above
Rows per family
Any rating shown
29,207
84.1%
84.3%
1.04×
100 or more reviews
11,643
94.9%
94.9%
1.07×
1,000 or more reviews
5,211
97.4%
97.5%
1.08×
10,000 or more reviews
1,642
98.1%
98.2%
1.06×
Read the last column. It is the one that decides whether this objection lands. If pooled review counts were manufacturing our deep-review cohorts, rows-per-family would climb as the review threshold rises — the 10,000+ bucket would be the same few products repeated. It does not climb: 1.04× across everything, 1.06× at 10,000 reviews and above. The 1,741 listings in that cohort are 1,642 distinct products.
Counting each variant family once — 1,236 rows, 4.1% of the set — moves every figure by two-tenths of a percentage point or less. The pooling also does not concentrate in the deep-review cohorts, which is what licenses the 10,000+ finding: 1.04 rows per family overall against 1.06 at 10,000+ reviews.
Nothing moves by more than two-tenths of a percentage point. Deduplication does not rescue the star rating.
2. “Your 84% is propped up by five-star products with three reviews.”
There are indeed 2,544 listings rated exactly 5.0 on fewer than 10 reviews, and 669 that display a rating while showing no review count at all. So we deleted every listing with fewer than 10 reviews — 9,451 rows, close to a third of the sample — and re-ran it. Among the 21,019 that survive, 90.4% are rated 4.0 or above, median 4.30. Removing the thin evidence raises the number rather than lowering it, because thin-evidence listings are where most of the genuinely low ratings live.
3. “Your combined figure is just your own coverage — you are mostly Nykaa and mostly beauty.”
The premise is correct, and we state it plainly: Nykaa is 61.3% of the rated listings and beauty is 50.4%. If the headline were an artefact of that skew, it would fall apart the moment sample size stopped voting. So we stopped letting it vote — averaging each reportable marketplace equally, and each reportable category equally, rather than weighting by how many listings we happen to hold:
Coverage-weighted against equal-weighted, share rated 4.0+
Averaged over
Groups
Weighted by our coverage
Each group counted equally
Range across groups
Marketplaces
3
84.7%
84.6%
80.5% – 88.2%
Categories
9
84.2%
84.8%
76.5% – 95.6%
Removing the weighting moves the figure by a tenth of a point on marketplaces and six-tenths upward on categories. Our Nykaa and beauty concentration is not what produces the result. The lowest single group we can report — electronics, at 76.5% — is still more than three in four listings at 4.0★ or above.
None of the three objections rescues the star rating. That is the point of publishing the checks.
What this data is, and what it is not
These caveats are part of the study. Anyone quoting the numbers above should carry them too.
It is not a random sample of Indian e-commerce.
This is ChayanKart's capture set — the listings we chose to collect, for our own catalogue. Beauty and Nykaa are heavily over-represented: Nykaa alone is 18,666 of the 30,470 rated listings, and beauty is 15,350. That means the combined 84.3% is not a national statistic and should not be reported as one. What defends the finding is that the same pattern appears inside every platform and every category measured separately, each of which we have printed above so you can check it.
Only 46.1% of our catalogue carries a rating at all.
Croma and Reliance Digital display reviews on a minority of their pages. Listings with no displayed rating are excluded from every figure here, and they may differ systematically from the ones included. We cannot rule that out.
Small samples are printed, not promoted.
Croma (343), Reliance Digital (192) and Nykaa Fashion (9) sit below our reporting floor of 1,000 rated listings. They appear in the table for completeness and are marked unquotable. See the note under that table.
It is a point-in-time snapshot.
Ratings are as displayed at the moment each listing was captured, and marketplaces recalculate continuously. The date on this page is the date the figures were generated, and the numbers here are frozen to that date deliberately — this is a study, not a live dashboard.
We did not verify whether any review is genuine.
This is the most important limit and the easiest one to overstate. Our claim is narrow and measurable: displayed star ratings fail to discriminate between products. That is a property of the distribution, and you can check it in the tables above. Whether any individual review is fake, incentivised or bought is something we did not test and cannot test from this data. We are not making that claim, and this study is not evidence for it.
How to reproduce this
Every number on this page — including both robustness checks — comes from a single script run against our catalogue: tools/study_star_ratings.py. It re-runs on demand, and it re-runs as the catalogue grows, which is why we can date the snapshot rather than hedge it.
The aggregate dataset behind every table on this page is a direct download — four-star-rating-problem-results.csv, no email required. It carries one row per published figure, including both robustness checks and the equal-weight comparison, so any number here can be checked without taking our word for it. We will send the script itself to anyone who asks: hello@chayankart.com.
What we will not send is the raw catalogue. It contains individual listings we know to be wrong — a small number of miscaptured prices we are still working through — and we are not going to hand out records we would not stand behind. The rating figures do not depend on price data: the script does not read a price field at all.
Related reading
If you want the practical version of this rather than the method: Does a product with more reviews mean it’s better? takes the review-depth finding above and turns it into what to actually do on a listing page.
Why we ran it
The self-interested reason, stated plainly: this problem is why ChayanKart exists. If 84% of listings look excellent, a shopper cannot use the rating to choose, and a site that republishes marketplace stars as “our top pick” is not helping either.
So we do not publish a rating as a verdict. We publish two separate numbers — a quality score anchored to the displayed rating, and a confidence level set by how much evidence stands behind it — and where the evidence is too thin we print no score and say why. Roughly seven in ten products in our catalogue currently fall into that category. The full formula is on our methodology page, and the products we assessed and refused to recommend are on our rejection list.
Corrections are welcome and we publish them. If you think a figure here is wrong, write to hello@chayankart.com — tell us what you checked and we will re-run it.
Cite, download, reuse
Everything below is free to republish with attribution and a link to this page. No permission needed, no notification required, no licence to sign. If you need a cut of the data we have not published, ask.
Cite it
ChayanKart Editorial Desk, “The 4-Star Rating Problem”, ChayanKart Data Study, version 1.0, dataset snapshot 19 August 2026. https://chayankart.com/four-star-rating-problem.html
Study version
1.0
Dataset snapshot
19 August 2026
Sample
30,470 rated listings, of 66,150 captured
Marketplaces
Amazon India, Flipkart, Nykaa, Nykaa Fashion, Croma, Reliance Digital
Charts are the same files rendered on this page. Please keep the ChayanKart attribution when reusing them.
Ask us
For a different cut — another review threshold, a single category, the analysis script, or a chart of any table above — write to hello@chayankart.com. We answer questions about method from anyone, including people intending to disagree with us in print.
Corrections are welcome and we publish them. Tell us what you checked and we will re-run it.